 Unsplash
US Commercial Real Estate Outlook H2 2026 - GRI Institute Report
Discover how global capital is navigating US debt distress, shrinking construction pipelines, and the AI boom across core property sectors
August 7, 2026Real Estate
Written by:Rory Hickman
Executive Summary
The US real estate market enters H2 2026 transitioning into an income-driven phase of stabilization as benchmark borrowing rates remain elevated.
Driven by steady macroeconomic growth, a resilient labor market, and massive enterprise capital deployment in AI, transaction activity is regaining momentum while operational performance continues to diverge sharply across property types.
While institutional liquidity concentrates in prime Class A assets, including data centers, logistics, and defensive healthcare, legacy stock remains burdened by debt distress - setting the stage for a supply-constrained rebound in landlord pricing power.
Ahead of upcoming GRI Institute gatherings featuring discussions on cross-border capital flows between the US and Asian, European, Middle Eastern, and Latin American markets, we analyze the latest market data to provide a strategic overview of the forces shaping the American real estate sector.
► Check out upcoming GRI Institute events featuring US real estate discussions at the end of the report
Driven by steady macroeconomic growth, a resilient labor market, and massive enterprise capital deployment in AI, transaction activity is regaining momentum while operational performance continues to diverge sharply across property types.
While institutional liquidity concentrates in prime Class A assets, including data centers, logistics, and defensive healthcare, legacy stock remains burdened by debt distress - setting the stage for a supply-constrained rebound in landlord pricing power.
Ahead of upcoming GRI Institute gatherings featuring discussions on cross-border capital flows between the US and Asian, European, Middle Eastern, and Latin American markets, we analyze the latest market data to provide a strategic overview of the forces shaping the American real estate sector.
► Check out upcoming GRI Institute events featuring US real estate discussions at the end of the report
Key Takeaways
- Total investment returns are shifting from cap rate compression toward steady operating income growth as benchmark borrowing rates remain elevated.
- Capital deployment is heavily bifurcating toward prime Class A assets, digital infrastructure, and modern logistics while legacy stock faces mounting debt distress.
- Historically low construction pipelines across major sectors are expected to absorb existing space and restore long-term landlord pricing power in the near term.
► Economy and Capital Markets
US economic expansion is expected to moderate to a consensus range of 1.5% to 2.1% in 2026, anchored by steady job gains, expanding business surveys, and resilient consumer spending tracking over 5% higher year to date.Persistent inflationary pressures, driven by volatile energy prices and supply chain disruptions, have elevated core personal consumption expenditures forecasts to 3.4%, prompting the Federal Reserve to hold policy rates steady at 3.50-3.75%.
Despite broader economic headwinds, massive enterprise capital deployment in artificial intelligence (AI) serves as a primary engine of growth. Capital commitments from the top five hyperscalers are projected to reach USD 730 billion this year, while the broader global AI infrastructure ecosystem attracts roughly USD 769 billion in total annual expenditure.
This investment boom is providing direct support to durable goods orders, IT spending, and utility grid modernization, even as high import volumes offset a portion of its net contribution to gross domestic product.
Capital market activity is regaining momentum as institutional investors adapt to higher-for-longer benchmark borrowing rates. The 10-year US Treasury yield is forecast to finish the year within a baseline range of 4.3% to 4.7%, reflecting a balance between late-quarter geopolitical relief and lingering inflation risks.
Overall US commercial real estate investment volume is on track to expand 16% year over year to approximately USD 605 billion, supported by a 25% surge in commercial mortgage-backed securities issuance and lower borrowing costs below 6%.
Average property capitalization rates have stabilized near 6.0%, shifting investor focus toward income growth as the primary driver of total returns, with yield compression largely deferred until 2027.
While capital availability is improving through alternative debt structures and private asset-based finance, distress remains elevated in legacy stock, pushing overall commercial mortgage-backed securities delinquency to 7.35%.
Sector fundamentals exhibit distinct trajectories, shaped by structural shifts in tenant demand and historical supply cycles.
Multifamily properties retain dominant institutional investment allocations with volume projected to rise 20% year over year, buoyed by housing affordability constraints, tight inventory, and a sharp reduction in new construction pipelines.
The office sector continues to bifurcate; national vacancy rates exceed 20% due to widespread hybrid work adoption, yet high-quality trophy towers have achieved eight consecutive quarters of positive net absorption, bolstered by an 85% year-over-year surge in AI-related leasing.
Industrial and logistics assets remain the fastest-growing property type by near-term square-footage absorption, propelled by e-commerce expanding to 16.9% of total retail sales, supply chain reshoring, and defense manufacturing needs.
Meanwhile, data centers and hospitality are generating rapid growth, with data center pre-leasing reaching 80% and hospitality posting a projected 9.16% compound annual growth rate through 2035.
From a broader perspective, the global commercial real estate market represents an estimated USD 37.3 trillion in total capital stock value, generating roughly USD 467.8 billion in annual sector revenues and services.
North America leads global institutional capital depth with a 37% market share, driven by deep capital markets, mature real estate investment trust structures, and Sunbelt population migration.
Although market participants view late second-quarter reductions in Middle East hostilities as a stabilizing factor that lowered travel costs and reduced short-term energy shocks, prolonged disruptions along critical transit corridors including the Straits of Hormuz and Bab-el-Mandeb remain the primary downside risk.
Absent further geopolitical escalation, disciplined supply delivery, robust labor markets, and multi-year capital cycles in power and digital infrastructure position the US real estate market for sustained stability.

Dallas, Texas (Unsplash)
► Multifamily Sector
The US multifamily sector demonstrated strong demand acceleration during the second quarter, successfully absorbing supply despite earlier first-half figures showing completions pacing ahead of absorption.Early national absorption totaled approximately 108,000 units, but a sharp second-quarter surge in top 60 primary markets generated net absorption of 152,856 units, which was more than double the 67,268 units delivered during the quarter. This momentum helped stabilize occupancy, which stands at 94.1% across broad national tracking and between 95.1% and 95.6% across core institutional markets.
The active construction pipeline continued to shrink, dropping to 498,090 units under construction and signaling a transition beyond acute delivery-driven softness.
Meanwhile, severe homeownership affordability barriers persist, as seller asking prices fell 2.5% year over year, closed transaction prices grew modestly by 0.8% year over year, and median single-family home prices reached USD 403,200, sustaining strong rental demand.
Overall national rent growth remains effectively flat, ranging between -0.2% and +0.4% year over year, as point-in-time advertised asking rents dipped slightly while trailing effective rents maintained minimal gains.
To preserve occupancy and maintain operating income, property owners heavily utilized concessions, offering upfront discounts on nearly 25% of units with an average price reduction of 7.6%.
Regional performance remains sharply bifurcated between supply-constrained gateways and high-supply expansion hubs. Supply-constrained coastal and Midwest markets led rent growth, highlighted by net effective and asking rent increases in San Francisco (+4.7% to +10.6%), New York (+3.2% to +5.6%), and Chicago (+2.6% to +2.9%).
Conversely, heavy construction pipelines in Sun Belt markets caused ongoing rent contractions, including in Austin (-4.0% to -5.1%), Phoenix (-2.7% to -4.0%), and Houston (-2.0%), though strong net absorption across these metros is accelerating market normalization.
Affordability and preservation pressures continue to challenge the residential landscape, with approximately 50% of US renter households spending over 30% of their income on housing, 26% spending over 50%, and low-rent stock under USD 1,000 per month having declined by over 30% over the past decade.
Furthermore, rent restrictions on roughly 845,000 Low-Income Housing Tax Credit (LIHTC) units are set to expire by 2035.
Capital markets, however, showed signs of resilience, as quarterly sales volume across top markets reached USD 22.8 billion and affordable housing sales volume rose 4% year over year to USD 19.5 billion.
Financial distress remains largely isolated to balance sheets rather than operations, with multifamily CMBS delinquency rising to 7.23% in Q2 due to high interest rates, tight refinancing conditions, and capital structure pressures.
Borrowers face sustained elevated debt costs, with average 30-year fixed mortgage rates expected to remain anchored in the 6.3% to 6.5% range through 2027 and 2028.
Legislative and policy shifts are increasingly shaping long-term supply dynamics and institutional capital deployment.
The enactment of the federal 21st Century ROAD to Housing Act, combined with state initiatives such as New York City's USD 4 billion affordable housing fund, aims to expand housing production, streamline entitlement processes, and modernize Federal Housing Administration (FHA) lending.
Federal enhancements to the LIHTC program could enable the development of over 1 million affordable units over the next decade, while new regulatory frameworks restrict large institutions from buying existing single-family homes at scale.
These policy measures encourage institutional capital to create new supply through build-to-rent (BTR) and multifamily developments rather than competing for existing housing stock.
As the Federal Reserve maintains a cautious stance on interest rates, aligning capital deployment with new construction, public planning, and long-term societal value will remain essential for institutional investors navigating the evolving US housing market.
► Hospitality
The US hotel sector demonstrated robust operational momentum through the first half of 2026, with Revenue Per Available Room (RevPAR) expanding 3.8% year over year in Q1 before accelerating to 4.0% year-to-date through April.This early-year strength, bolstered by major international event drivers like the FIFA World Cup, national celebrations such as the 250th anniversary of the US Declaration of Independence, and major concert tours, prompted mid-year forecast upgrades that place full-year 2026 RevPAR growth in a range of +2.5% to +2.8%.
Market resilience is being driven by sustained leisure travel and a solid recovery in group, convention-linked, and regional corporate travel, which together are projected to contribute over half of annual RevPAR growth.
While individual business transient occupancy in major central business districts continues to lag 2019 pre-pandemic benchmarks due to hybrid work patterns, strong demand across technology hubs, infrastructure project markets, and organized corporate events has effectively counterbalanced individual transient softness.
Performance across property tiers remains sharply bifurcated, driven by K-shaped consumer behavior and uneven economic conditions across income demographics.
Upper-end segments lead industry performance, with the Luxury tier projected to achieve full-year RevPAR expansion of 5.2%, insulated by affluent domestic households, recovering international inbound travel, and high credit capacity.
In contrast, lower-end midscale and economy tiers continue to lag (+0.7% and -0.6% respectively), as price-sensitive consumers adapt to personal debt stress, auto loan obligations, and rising delinquency pressures.
With traditional macroeconomic indicators such as GDP having lost predictive accuracy for lodging demand, forecasting now relies on tier-specific metrics, utilizing credit behavior for upper scales, income distribution dynamics for middle tiers, and consumer distress variables for lower tiers.
On the supply side, new inventory additions remain historically constrained at +0.4% for 2026, with the in-construction portion of the development pipeline at a 12-year low of 19% and total three-year inventory growth projected at a modest 0.7% compound annual growth rate, maintaining a structural floor for Average Daily Rate (ADR) stability.
Capital markets and transaction activity are entering a more actionable phase, driven by shifting seller pricing expectations and significant debt maturity volume. Property owners are increasingly accepting updated valuations after years of holding onto peak-market pricing expectations, pressured by cash flow shortfalls and expiring debt terms.
Nearly 70% of the USD 18.7 billion in hotel CMBS loans maturing in 2026 carry floating interest rates, prompting lenders, special servicers, debt funds, and regional banks to force final loan resolutions rather than offer extensions.
While institutional capital continues to bid aggressively on luxury and trophy assets, primary investment opportunities center on middle-market assets that possess strong underlying operational fundamentals but suffer from impaired capital structures, favoring well-capitalized buyers who can execute operational repositioning and complex debt restructurings.
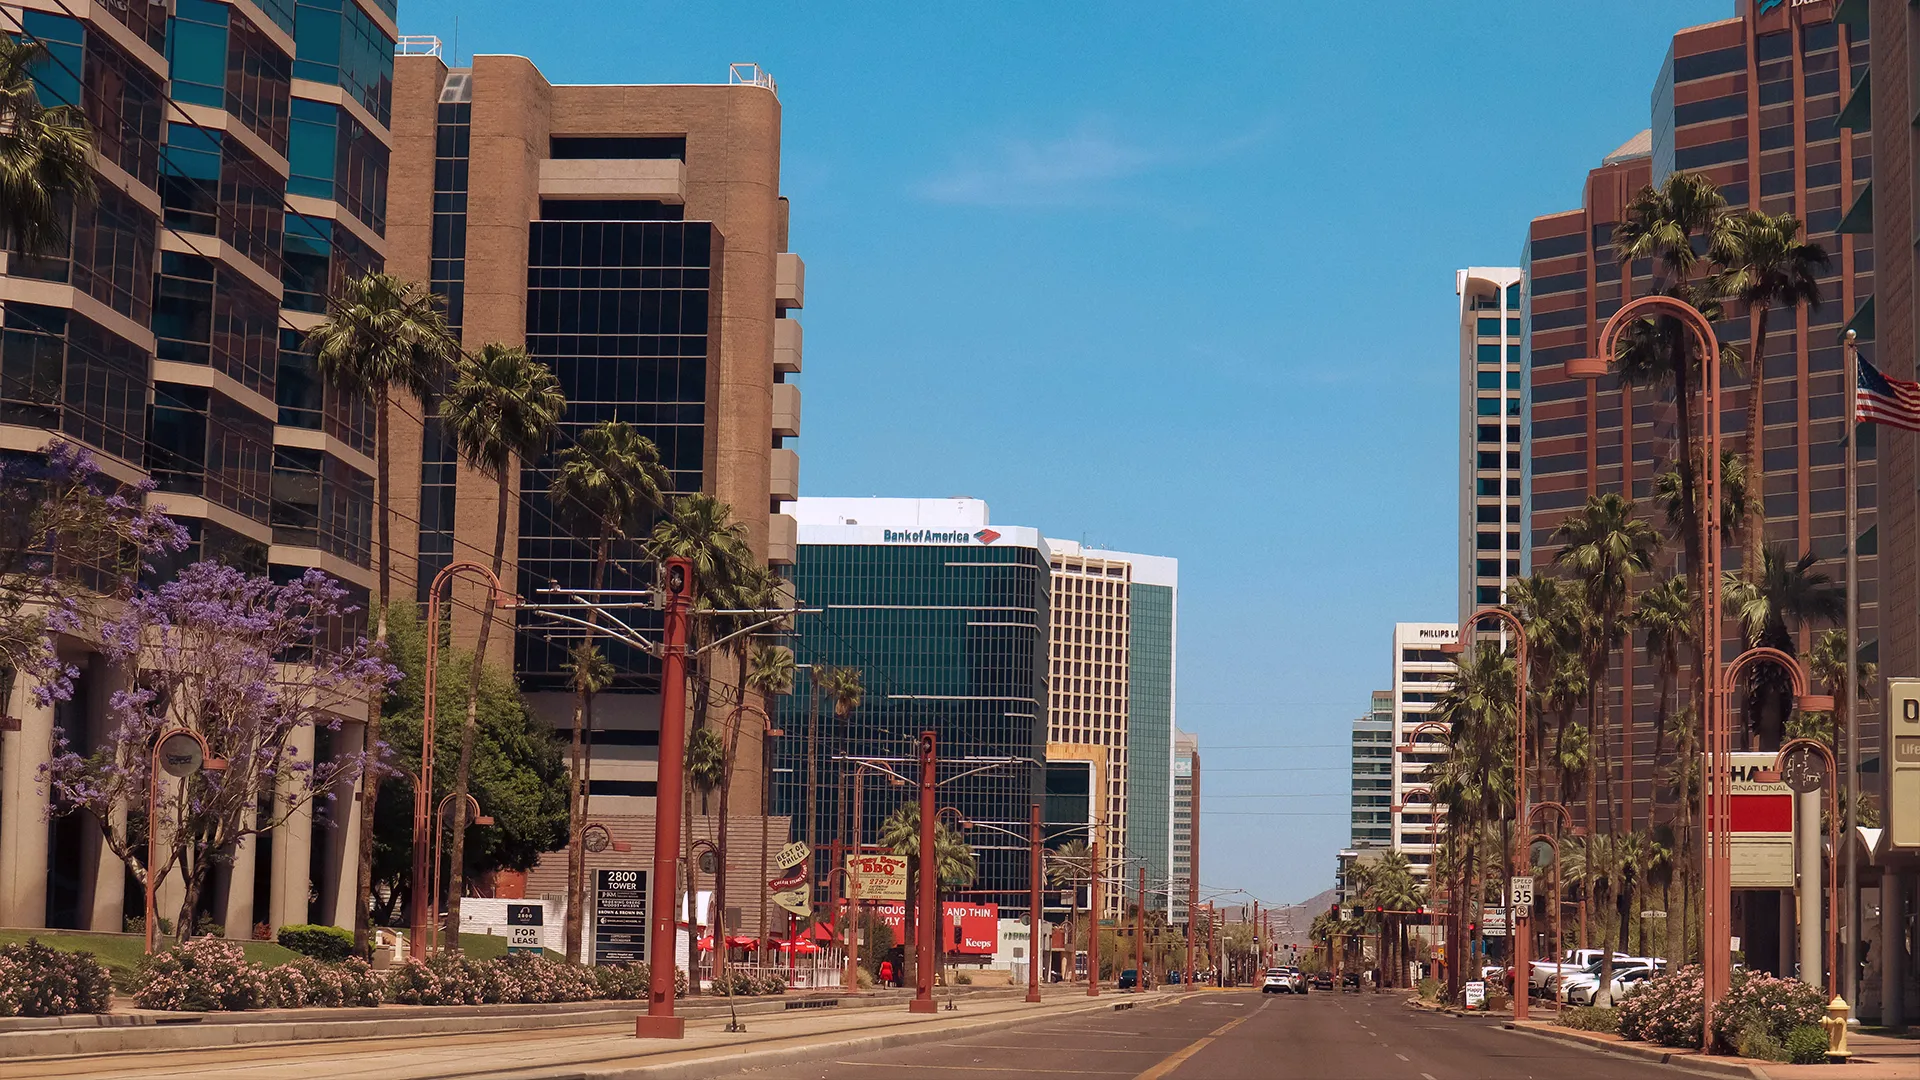
Phoenix, Arizona (Unsplash)
► Offices
US office leasing momentum accelerated sharply in the first half of 2026, driven by a surging return of major corporate occupiers, technology firms, and gateway market demand.Gross leasing activity reached a post-pandemic high of 55.1 million sq ft in Q2 2026, representing a 7.1% year-over-year increase, while trailing 12-month leasing volume climbed 27% relative to its five-year average.
Technology occupiers led total leasing volume by capturing 21% of total H1 2026 activity - approaching their 2019 peak share - with AI organizations taking a central role. Growth was further supported by significant demand surges in Aerospace & Defense (+37%), Legal Services (+31%), Professional Services, and Government sectors.
Occupier conviction strengthened substantially across major markets, as 66% of surveyed tenants plan to maintain or expand their footprint over the next three years, and 64% of technology firms intend to grow their office space.
This confidence is reflected in expanding lease terms, with commitments of 10 years or more accounting for 57% of H1 2026 leasing volume.
Geographic demand remained heavily concentrated in major gateway hubs, where leasing momentum rose 14% year over year; the San Francisco Bay Area and Manhattan alone accounted for 55% of all tech leasing, while downtown leasing volume surged 24% nationwide.
Net absorption and occupancy fundamentals demonstrated robust gains, with Q2 2026 net absorption estimated between 11.2 million and 16.9 million sq ft - marking the strongest quarterly performance in seven years - and pushing trailing 12-month net occupancy gains above 30 million sq ft.
Dependent on brokerage coverage criteria, overall US office vacancy sits within a range of 18.0% to 21.6%, reflecting a quarterly contraction of between 20 and 60 basis points. Central business district vacancy fell to 19.0%, while suburban vacancy dropped to 17.5%, leaving a spread of 1.3 to 1.5 percentage points that analysts project will invert by mid-2027.
Demand was overwhelmingly concentrated in high-end properties, as Class A assets captured 21 million sq ft of net absorption in the first six months of the year.
This flight to quality broadened the vacancy gap between prime and non-prime space to record levels, causing demand to spill over into secondary properties across key markets such as Manhattan, San Francisco, San Jose, and Phoenix.
Concurrently, sublease space availability continued its multi-year decline to 153.5 million sq ft, down 18.3% from its 2023 peak.
Capital markets also responded positively to these operational gains, as single-asset office transaction volume expanded 32% year over year in H1 2026 to USD 27 billion, lending originations rose 36%, and commercial mortgage-backed securities delinquency rates dropped by 32 basis points.
On the supply side, new construction remained severely constrained, widening the inventory deficit as space conversions alone outpaced groundbreakings by seven to one, while conversions and demolitions combined outpaced completions for a second consecutive year.
Total active office space under development fell to a record low of approximately 23 million sq ft, with year-to-date completions capped between 4.0 million and 5.1 million sq ft - led by deliveries in Dallas and Denver.
With new supply scarce and prime space tightening, full-year 2026 rent growth projections were revised upward to 2.7% year over year. Rent levels varied by listing structure, with full-service asking rents averaging USD 38.03 per sq ft overall and USD 43.74 per sq ft for Class A properties, while direct asking rents averaged USD 40.27 per sq ft overall and USD 45.87 per sq ft for Trophy and Class A space.
High-end leasing exceeding USD 100 and USD 200 per sq ft set trailing 12-month records, even as landlords offered expanded tenant improvement allowances averaging USD 107 per sq ft on 10-year commitments.
Looking ahead, workplace strategies are increasingly prioritizing space quality over total square footage through flexible lease structures, collaborative layouts, hospitality-driven amenities, and the reintroduction of assigned seating to support organizational culture and employee retention.
► Retail
US retail sales expanded between 6.7% and 6.9% year over year (or 5.4% excluding gasoline stations), demonstrating resilient consumer spending that is increasingly concentrated among higher-income households.Despite ongoing cost-of-living and tariff pressures, tenant demand remains strong, driven primarily by necessity-based operators like grocery stores, discount retailers, health and wellness concepts, and fast-casual food purveyors.
Sector stability is further supported by store expansion dynamics, which have transitioned from an equal balance of openings and closures in mid-2025 to planned store openings consistently exceeding closures in 2026.
On the supply side, construction completions remain well below historical averages, with Q2 2026 deliveries adding just 2.3 million square feet and the active development pipeline accounting for less than 0.3% of total inventory. This prolonged supply constraint continues to reinforce solid operational fundamentals and support landlord pricing power across the country.
National retail vacancy holds at 6.0%, remaining well below its 7.4% historical average, while overall retail availability sits at 6.8% with projections expecting a decline to 5.4% by 2035.
Annual asking rent growth has moderated to a range of 1.6% to 2.2%, signaling a transition toward a more balanced market environment as tenant occupancy costs reach pre-pandemic levels.
Regional performance reflects shifting dynamics; the South led trailing annual rent growth at 3.3%, though future pricing momentum in the Sun Belt is expected to temper as rents reach peak levels. Instead, supply-constrained Northeast coastal markets are projected to drive future rent increases, led by Manhattan (+4.5%) and Stamford (+3.6%).
In terms of demand distribution, Sun Belt metros including Dallas, Houston, and Phoenix lead total volume in net absorption and new construction, while the West region recently captured the strongest quarterly net absorption surge at 1.3 million square feet.
Suburban retail formats continue to outpace traditional downtown urban cores, supported by shifting demographic preferences as Gen Z and Millennials, who will account for 74% of the global workforce by 2030, drive suburban convenience culture.
Occupiers are increasingly prioritizing smaller, flexible store footprints under 2,500 square feet to minimize capital costs, while grocery stores under 30,000 square feet are outperforming larger formats in foot traffic growth.
Property type performance remains split, as neighborhood, community, and strip centers dominate construction deliveries at 82% of completions and maintain strong occupancy, whereas regional mall vacancy has risen to 10.5%.
To maintain foot traffic and adapt to changing habits, brands are leveraging short-cycle retail formats, pop-up stores, and experiential concepts, with the global experiential retail market projected to expand from USD 132 billion in 2025 to over USD 543 billion by 2035.
► Industrial Logistics & Warehousing
The US industrial real estate market experienced a robust acceleration through mid-2026, with annual leasing growth forecasts upgraded to 10% as occupiers expanded footprints to mitigate supply-chain disruptions.Demand was jointly driven by third-party logistics (3PL) providers, manufacturing companies, and data center operators.
While 3PL providers maintained a six-quarter streak of broad market absorption leadership, manufacturing deal activity surged to become the leading tenant class by quarterly volume, fueled by federal legislation, nearshoring strategies, and infrastructure investments.
Occupier preference heavily favored modern Class A facilities, big-box spaces exceeding 500,000 square feet, and specialized high-power properties equipped for robotics and AI staging, leaving older pre-2000 inventory facing elevated vacancy and tenant outflows.
Supply dynamics reached a turning point as physical space absorption outpaced new completions, which dropped to near-decade quarterly lows of 53 million to 62 million square feet depending on property size thresholds.
Robust demand pushed second-quarter net absorption to between 59 million and 99.1 million square feet across major surveys, bringing first-half cumulative net absorption up to between 160 million and 167.4 million square feet.
Consequently, national physical vacancy stabilized in a tight range between 6.8% and 7.3%, whereas broader total availability, which includes occupied space being actively marketed for sublease, stood near 9.6%.
Meanwhile, developers began cautiously resuming warehouse construction, expanding the active pipeline to between 276 million and 312 million square feet as specialized build-to-suit projects and data center facilities offset high financing costs.
Pricing and investment activity reflected a bifurcated landscape across property tiers and geographic regions. Nominal direct asking rents for modern Class A inventory grew between 1.7% and 1.8% year over year to reach USD 10.45 per square foot, led by domestic-distribution hubs in secondary Sunbelt and inland markets.
Conversely, overall effective asking rents dipped 1.6% to USD 10.14 per square foot in select coastal markets undergoing pricing corrections and landlord concessions.
Capital market volume accelerated sharply in Q2 to USD 57.4 billion, driving total first-half transaction volume up 37.4% year over year, anchored by a record USD 6 billion in owner-user sales and stable cap rates in the mid-5% range.
Looking ahead, inland multi-node logistics networks and strategic manufacturing clusters remain poised to absorb remaining capacity, even as occupiers navigate interest rate uncertainty, trade friction, and macroeconomic headwinds.

San Francisco, California (Unsplash)
► Data Centers
Surging AI adoption and hyperscale expansion continue to drive extraordinary momentum across the US data center sector, with construction spending more than doubling year over year as construction costs reach USD 14 million to USD 16 million per megawatt for top-tier facilities.The total national development pipeline encompasses nearly 4,500 announced and active projects, with over 1,500 facilities reaching advanced planning or construction stages across key states, including Texas at 466 total sites and Virginia at 685 total sites.
Persistent occupier demand reduced primary market vacancy to a record low of 1.4% in H2 2025, driving North American under-construction preleasing from nearly 75% in H1 2025 to an upgraded 80% forecast for primary markets in 2026.
However, power procurement timelines stretching up to ten years and grid interconnection constraints in core hubs like Northern Virginia are forcing developers toward emerging markets in West Texas, Indiana, and Pennsylvania, while accelerating the deployment of up to 25 GW in on-site, behind-the-meter power solutions including natural gas turbines, fuel cells, and small modular nuclear reactors.
Site selection requirements are expanding rapidly as operators prioritize parcels offering at least 250 megawatts of power and 125 acres of land, sparking intense competition that is reshaping regional real estate dynamics.
Developers are offering massive land premiums to secure acreage, with transaction values reaching up to USD 360,000 per acre and distorting traditional appraisal models in primary and expansion markets.
Asking rents for 250-500 kW requirements are projected to exceed USD 215 per kW per month as record low vacancy persists.
This rapid land acquisition creates a distinct dual effect on local housing markets, where homes directly adjacent to new facilities face buyer resistance, construction disruption, and noise concerns, while the broader regional market experiences structural upward pressure on land values, high rental demand from temporary construction crews, and direct competition between data center developers and residential builders.
From an economic perspective, state governments continue to aggressively incentivize development through specific tax exemptions, with 37 states offering sales tax relief that generated nearly USD 6 billion in exemptions across sixteen reporting states over five years.
While community pushback has grown over municipal water consumption, rising electrical capacity rates, and rural rezoning, the overall economic footprint remains substantial. Direct site operations maintain lean staffing levels of under 200 permanent employees per facility, which are often filled by specialized outside talent rather than local residents.
However, this direct operational footprint is counterbalanced by significant initial construction labor of roughly 1,500 workers per site and a broader six-to-one indirect job multiplier, allowing the industry to support over 74,000 jobs in Virginia and 95,000 jobs in Ohio while generating tens of billions of dollars in annual economic output nationwide.
► Life Sciences & Healthcare
The US life sciences real estate sector is exhibiting foundational signs of recovery following a historic downturn, supported by accelerating biotechnology R&D employment, a four-year high in year-to-date public listings, and expanding venture capital inflows that reached USD 9.2 billion in Q2 2026.Across a total national footprint estimated between 202.97 million square feet across 12 core markets and 239.5 million square feet nationwide, supply headwinds are abating.
Active development has dropped sharply to between 4.7 million and 7.76 million square feet depending on geographic tracking scope, representing an 88% contraction since mid-2023.
With full-year 2026 deliveries projected at a 10-year low of 3.0 million to 4.5 million square feet and pre-leasing on near-term space averaging 72%, speculative construction is tapering off to help stabilize sector fundamentals.
Although overall national lab vacancy expanded into mid-2026 to sit between 22.4% direct vacancy and 27.1% total availability, accelerating net space absorption during the second half of the year is expected to compress full-year vacancy to approximately 22.5%.
Regional conditions remain highly bifurcated by submarket quality and geography. Low total availability persists in tight submarkets like Los Angeles-Orange County at 4.1% to 8.0%, whereas major primary markets face substantial inventory options, with total availability ranging between 31% and 40% across New York City, Boston, and the San Francisco Bay Area.
A similar divergence appears between direct stabilized space and overall availability, highlighted by Philadelphia's 7.7% direct vacancy rate compared to its 27.2% total availability rate.
Asking rents continue to adjust downward, with average direct asking rents softening to between USD 64.17 and USD 64.96 per square foot nationally, spanning from USD 29.87 per square foot in New Jersey to USD 99.17 per square foot in prime New York City spaces, alongside record landlord concession packages approaching one month of free rent per year of lease term.
Outperforming the research and development sector, the US medical outpatient building (MOB) market continues to serve as a high-performing defensive asset class, driven by aging demographic demand, expanding outpatient specialty care, and shifting payer preferences toward lower-cost community care settings.
National MOB occupancy remains exceptionally stable between 90.2% and 92.7%, with full-year 2026 vacancy projected to end at 9.7%.
Elevated land, labor, and financing costs have curtailed project groundbreakings, reducing active construction from a mid-2025 peak of 33.5 million square feet down to 19.6 million square feet in Q1 2026 and pushing adaptive reuse projects to a record 5.5% of total healthcare development.
Average direct triple net lease (NNN) asking rents have risen steadily to between USD 25.35 and USD 26.64 per square foot, led by Sun Belt growth corridors and high-cost metros such as Los Angeles at USD 37.00 per square foot.
Capital allocation reflects strong investor confidence, as Q1 2026 MOB investment sales volume surged 39% year over year to USD 1.8 billion, average cap rates stabilized at 6.7%, and one-year total returns reached 6.0%, outperforming general commercial real estate averages.
► US Real Estate Outlook
The US commercial real estate market enters the second half of 2026 transitioning into an income-driven phase of stabilization, leaving behind the immediate shock of interest rate adjustments and acute delivery gluts.Driven by steady macroeconomic growth, strong labor markets, and massive capital commitments toward artificial intelligence and energy infrastructure, overall sector transaction volume is regaining momentum.
A clear operational divergence continues to define performance across every major sector, where prime Class A properties, specialized logistics hubs, data centers, and medical facilities capture the vast majority of occupier demand and institutional liquidity.
In contrast, legacy stock and outdated secondary space remain weighed down by capital structure pressures and elevated delinquency, accelerating loan resolutions, asset conversions, and debt restructurings.
Looking beyond 2026, the commercial real estate ecosystem is anchored by historically constrained development pipelines, favorable demographic trends, and supportive public infrastructure policies.
As active construction across the multifamily, office, retail, and life sciences sectors drops toward multi-year lows, tightening vacancy across stabilized inventory will gradually restore landlord pricing power and support durable rent growth.
Capital deployment will increasingly focus on structural growth drivers, prioritizing modern digital infrastructure, domestic manufacturing corridors, necessity-focused retail, and housing preservation initiatives.
Investors and occupiers who proactively address near-term debt maturities, reposition underperforming real estate, and target supply-shielded submarkets will be uniquely positioned to achieve superior long-term returns.
► Continue the conversation at the GRI Institute’s key upcoming gatherings featuring US real estate discussions around the world:
- Europe GRI 2026 - Summer Edition - 9th-10th September - Paris, France - Summit
- Featuring the International Capital - Global Macro Forces Shaping Strategies panel
- Latin America GRI RE 2026 - Miami Edition - 17th-19th November - Miami, USA - Summit
- Featuring a range of discussions on capital flows and emerging investment opportunities between the US and Latin America
- GRI Global Summit 2026 - 9th December - Abu Dhabi, UAE - Summit
- Featuring the United States: Where the Cycle Turns panel and a number of discussions on global capital flows
Sources:
2026 Mid-Year Investment Perspectives - Blackstone
US Real Estate Market Outlook Midyear Review 2026 - CBRE
CNBC Housing Market Survey - CNBC
US Office Market Outlook Report Q2 2026 - Colliers
US Capital Markets Snapshot Report Q2 2026 - Colliers
Beyond GDP and Inflation - CoStar
US Hotel Forecast Assumptions Q2 2026 - CoStar
Q2 2026 US Retail MarketBeat - Cushman & Wakefield
US Logistics & Industrial Monthly Trends & Insights - Cushman & Wakefield
US Life Sciences MarketBeat - Cushman & Wakefield
Vital Signs 2026 - Cushman & Wakefield
United States: Quarterly Credit Brief 3Q26 - Fitch Ratings
Mortgage Rates Forecast For 2026 - Forbes
US Office Market Dynamics Q2 2026 - JLL
US Industrial Market Dynamics Q2 2026 - JLL
US Lab Property Report 2026 - JLL
Midyear economic outlook for 2026 - J.P. Morgan
June 2026 CRE Market Insights - NAR
Medical office real estate outlook - PwC
CRE Market Size, Share & Global Forecast 2026-2035 - S&S Insider